
Investigation of Current Status of Bitcoin – worth of Readig
In this post – I’m going to examine Bitcoin across the board covering the following:
1.Basic Technical Analysis ( Trend Lines , Candlestick formations, Moving Averages)
2. Elliot Waves Analysis
3.Marcet cap analysis, Volume Analysis, Fundamental Analysis .
4.Number of short positions (BITFINEX)
5.Number of long positions (BITFINEX)
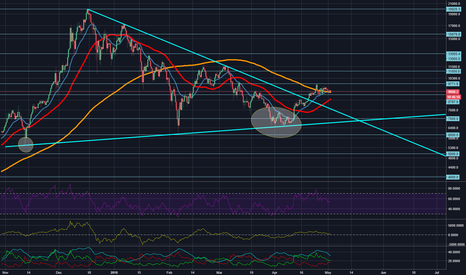
1.From a Daily chart , we can see that BTC bounced well from the year 2017 trendline and broken aggressively countertrend line. Additionally, 50 MA and 20EMA generated the cross signal which us bullish as well. On the other hand, we can see so-called “Death Cross” – crossed 200 and 50 MA, as well as that price bounced back down from 200 MA with the bearish engulfing candlestick formation.
From the weekly chart, we can see a nice bounce from 50 MA and 20 EMA and 200 MA heading upwards.
That’s: 4 points for Bulls and 3 points for Bears.
2. From Elliot wave Analysis it seems BTC forming Symmetrical Elliot Triangle Wave (ABCDE) in a Bull market as part of the 4th correctional wave. We saw 5 waves down and only 3 waves up so far, however, there is still a high possibility of the aggressive bullish move because as you can see Bears struggle to overtake a control. However, if Bulls will not be able to make a break above 10 000 lvl we can assume that Bear market continues and that this was ABC correction after 5 ways down.
3. From CoinmarketCap we can see that BTC capitalisation increased from 112,467,000,000 to 157,350,000,000 (today’s data). Thursday 26 of April was the highest daily volume of BTC Futures since the introduction to NYSE. That means that Bitcoin whales coming back to the market and institutional investors start to invest heavily after paying taxes on their accumulated profit over the last year. From recent news Rockefeller, RockFund and George Soros started to invest heavily in cryptocurrencies thus its time to watch if this volume continues.
Additionally, during G20 meeting – policymakers didn’t see any danger to the economy from cyptocurrencies and decided just to continue to observe the behaviour of a new financial instrument ( BTC Futures ).
https://coinmarketcap.com/currencies/bitcoin/historical-data/
https://cointelegraph.com/news/institutional-investors-will-bet-big-on-cryptocurrencies-in-2018
That’s: 4 Points for Bulls and 0 points for Bears
4. BITFINEX provide data of number of Short position of their traders. From chart we can see that number of short positions start to deacrease and that’s a good sign for Bull, as well RSI is not oversold yet and means that more downside in number of shorts – still possible
That’s: 1 Point for Bulls and 0 points for Bears
5. BITFINEX provide data of number of Short position of their traders. From Chart we can see that number of long positions are decreasing as well, however it’s extremely oversold right now on RSI and if we go back to few month ago we can see what happened when number of long positions went so low before. We can expect growth in number of long positions in a next few weeks.
That’s: 2 Points for Bulls and 1 point for Bears
To conclude my Analysis lets count points of Bulls and Bears:
In overall: 11 points for Bulls and 5 Points for Bears.
The Overall sentiment of the market is positive right now but price action is too slow. If we see a bit more aggresive move towards 10 000 – I think we will gove to 12,500lvl easily by the end of May.
Please like and subscribe if you want more analysis from me, because your feedback encouraging me for more action…
Good Luck,
VW.
Disclaimer: I am not a financial advisor, Im just giving you my thoughts and analysis.