A number of formations on the longer term charts are pointing to a higher NZD as the USD melts away post a very poor ISM last night.
For those of you who don’t know, the Kiwi is the national bird of New Zealand. It is a flightless bird, and it is also the nickname for the New Zealand Dollar in the world’s financial markets. However, the Kiwi (NZD) is looking anything like flightless after the last 24 hours price action. If anything it appears to be getting ready to fly higher.
A combination of data and yield hunger today and investment grade yield hunger continues to thwart the RBNZ’s talk the Kiwi down policy. Only a Fed hike this month and a hawkish outlook for the December meeting can save it now. Like so many others as I touched on yesterday the RBNZ will be hoping the Federal Reserve will do the heavy lifting it cannot. I suspect they will be disappointed…
The search for yield is a well-documented story. In today’s zero percent world New Zealand has it in abundance. ANZ’s Truckometer survey came out much higher than expected earlier this week. Then we had a better than expected Global Dairy Auction overnight for the third month in a row. (dairy is NZ’s largest export) A shocking US ISM number also saw the USD marked down across the board. Finally, we hear today that despite impending RBNZ property controls at the end of this month, the average price of a house in Auckland has hit NZD 1 million. (most annoying to this Kiwi as well)
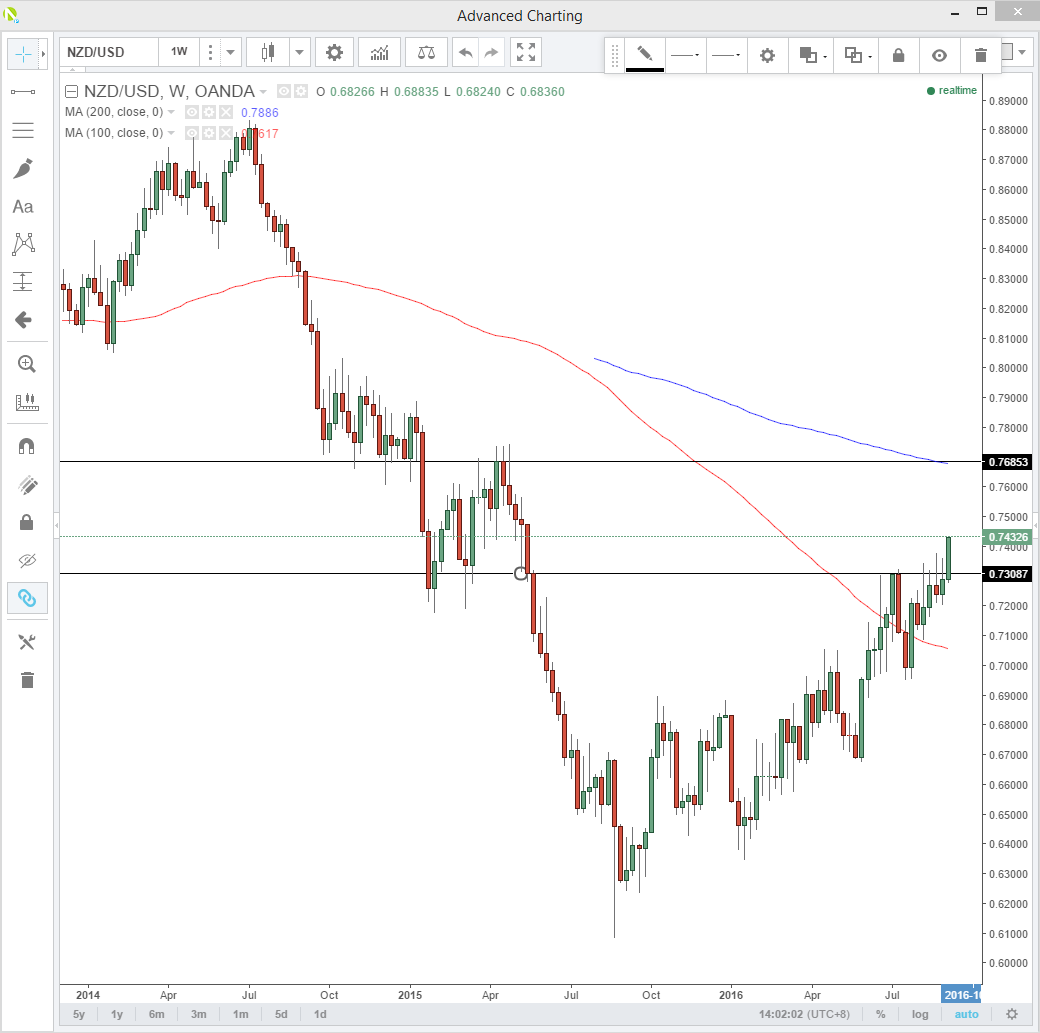
NZD/USD
Kiwi has broken weekly resistance at 7310 and technically looks poised to fly higher. Looking at the weekly chart below we see a weekly close above 7310 opening a move to 7685 initially. It is a multi-week pivot line and also the 200-week moving average.
Support is at 7310 on both the daily and weekly charts.
Things are looking interesting again on a few of the NZD cross as well.
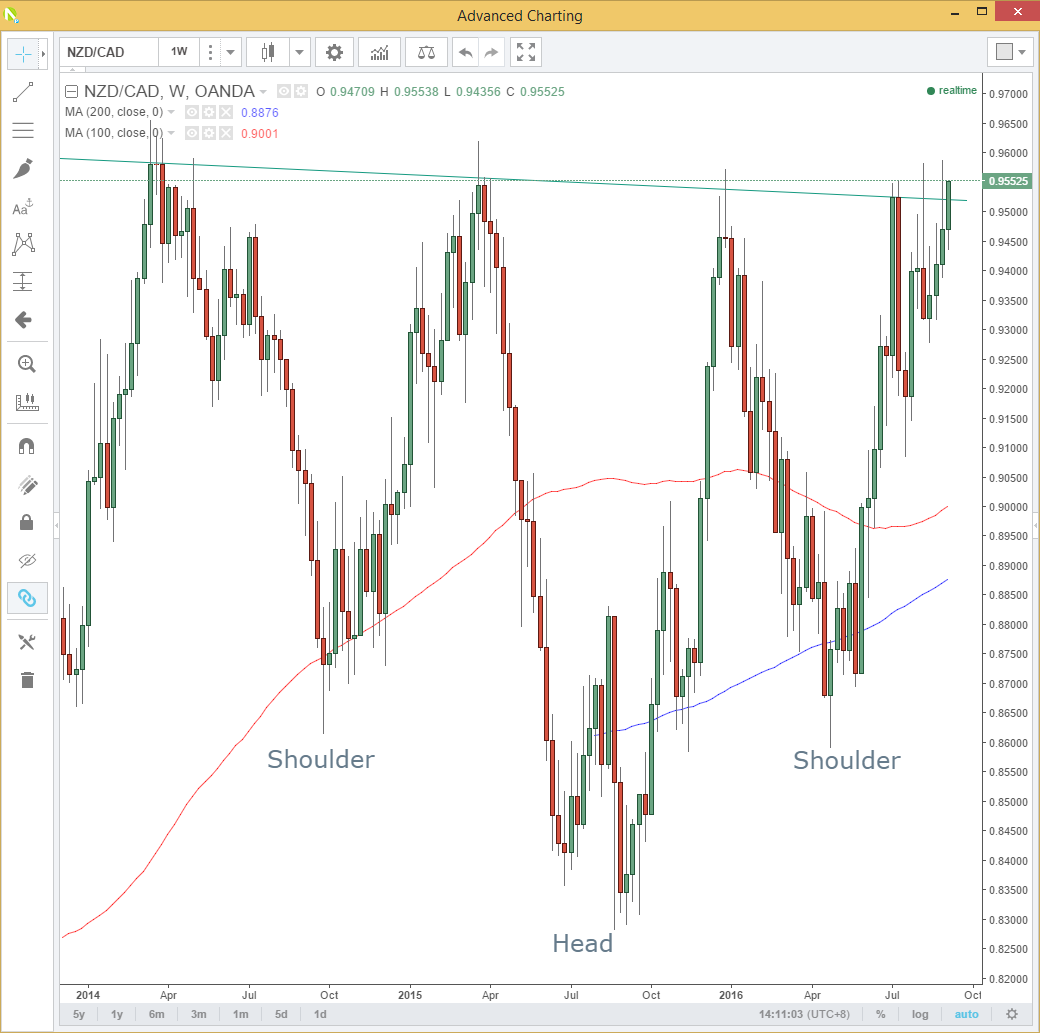
NZD/CAD
We revisit my old friend the NZD/CAD weekly chart. With the inverse head and shoulder formation dating back to early 2014.
Once again the neckline is being challenged at 9525 on a weekly basis. A close and consolidation above here on a technical basis portends a multi-month move towards 1.0700. This chart has teased me before I will admit but it seems to be the formation that just won’t go away.
We will need to see the CAD come under pressure to help the cross along. A disappointment on oil production freezes from OPEC later in September could be just what we need. A lower oil being bearish for the CAD in general.
AUD/NZD
As Helen of Troy was the face that launched 1,000 ships, so the AUD/NZD cross is the cross that broke a 1,000 hearts. Ask any trader who has sold this cross below 1.0400 looking for a break of parity and watch tears well in their eyes.
Could this be finally that time? A weekly close below 1.0350 on the charts suggests a move to 1.0065 and then the all-time lows of 1.0020. The AUD is also a beneficiary of the great yield hunt. However, a divergence in the respective economic performances of the Antipodeans sees the cross move solidly lower.
The question may be will the Kiwi break parity with the Aussie? The answer is I don’t know. The chart tells me we trade lower from here, and the price action should we trade toward the all time lows will then have to be reassessed. My brain says that a New Zealand Dollar should never be worth more than an Australian one. Having said that negative yield out to 10 years on German, Japanese and Swiss Bonds doesn’t make sense either, so who knows in these times?

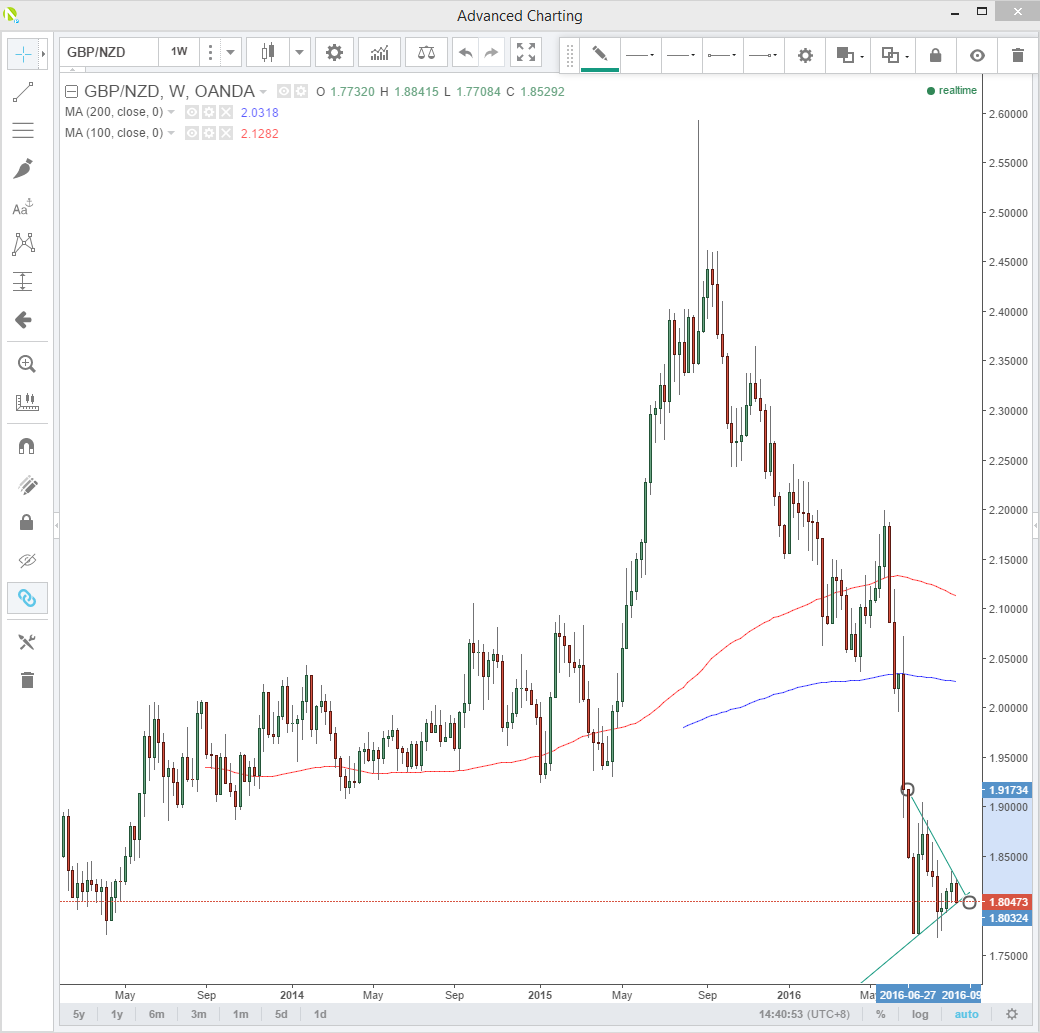
GBP/NZD
The squeeze is well and truly on in GBP/USD post-ISM. And like the sellers of AUD/NZD past, one imagines there will be more tears to come from Brexit GBP shorts before it is done.
The NZD is delicately poised against Her Majesty’s Pound. With a pennant formation on the weekly chart. Giving the formation some lee-way, a weekly close above 1.8285 signals a move back to 1.9170.
A weekly close below 1.7940 implies a move lower by the length of the pennants flag pole. I am using 2.0300 in this case indicating on a technical basis a target of 1.4600 area! One imagines that things have got very interesting in the world if this has come to pass.
The strength of the GBP/USD short squeeze will dictate whether we break higher or lower in the big picture but the formation is certainly worth monitoring.
EUR/NZD
Sitting at multiweek support at 1.5120. A weekly close below this level implies a move to 1.4550. 1.5120 holding means continued sideways trading in the 1.5120/1.5685 range continues.

Summary
Last night’s poor ISM was a catalyst that has unleashed the NZD technically. The Kiwi has been bubbling under chart wise for a while now, and one must feel a bit sorry for the RBNZ who can now only watch and hope the Federal Reserve comes to the hiking party. The hunt for yield trumps all otherwise, and the flightless bird appears to be getting ready to soar against quite a few currencies.