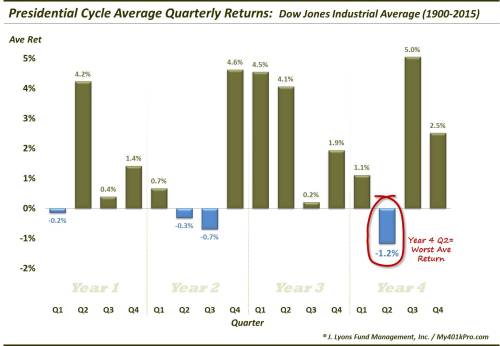
The 2nd quarter of election years has the worst average historical return of the 4-year Presidential Cycle.
For centuries, observers have attempted to identify patterns, or cycles, occurring in market prices. In the U.S. stock market, perhaps the most widely cited cycle is the 4-year Presidential cycle. As the name implies, the cycle has to do with the market’s behavior vis-a-vis the 4 years during a presidential term. Researchers have discovered that, for whatever reason, stocks tend to do better during some parts of the cycle and worse during others. Of course, some periods almost have to out-perform and other periods almost have to under-perform. However, the disparity between the historical “have’s” and “have not’s” is quite remarkable. And we just so happen to be entering the “have not”-est quarter of the cycle.
Using the Dow Jones Industrial Average (DJIA) since 1900, the 2nd quarter of election years (i.e., “year 4″) has the lowest average return (-1.2%) of any quarter in the entire cycle. Here are the average quarterly returns of the 4-year cycle in sequential order:
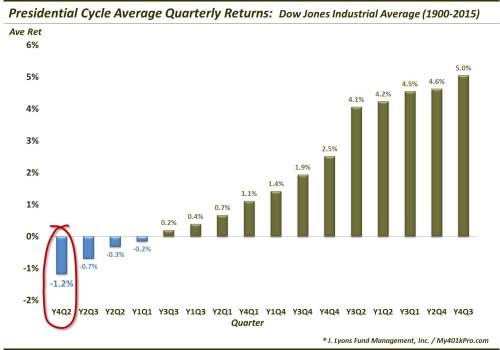
Here is the same data in order of historical performance:
Again, every year is unique and “averages” are, by definition, made up of higher and lower figures. Therefore, a poor 2nd quarter is far from a sure thing for stocks. However, the historical odds do not favor a very robust quarter.
And, as mentioned, the disparity between the average performance among some of the quarters is quite alarming. For example, the upcoming quarter is the only one of the cycle that has averaged a loss of over 1%. Meanwhile, there are 5 quarters in which the DJIA’s average performance is over +4%. The asymmetrical return distribution suggests that there is something to the cycle’s historical tendencies.
On a slightly brighter note, while the 2nd quarter of year 4 has the worst average return, it has actually shown a positive return just as often as all but 5 other quarters in the cycle. The culprit, obviously, has been in the size of some of the historical losses in the quarter. For example, the quarter owns the record for the all-time biggest quarterly loss in Presidential cycle history at -41.6% in 1932.
Lastly, some folks argue that these types of cycles or tendencies are really relics of the past and not very useful anymore. We would agree that many of these seasonal tendencies get arbitraged away over time to the point where there is very little practical utility in them. We would also agree with the notion of placing greater emphasis on more recent events as tendencies do evolve.
Neither of these qualifiers appear to allay the traditionally negative effects of the upcoming quarter, however. Consider the year 4, 2nd quarter returns during the previous 4 cycles:
- 2Q 2000: -4.3%
- 2Q 2004: +0.8%
- 2Q 2008: -7.4%
- 2Q 2012: -2.5%
But for the small gain in 2004, the last 4 cycles have seen the quarter close in the red. This suggests that perhaps the cycle is still a relevant force rather than some relic like President Lincoln’s mountain bike pictured above (that’s not really him, by the way).
Once again, this doesn’t guarantee a rough quarter coming up. These seasonal trends should be treated as either a slight headwind or tailwind for the market, not as an excuse liquidate or leverage up one’s portfolio. And if the historical tendency holds true, the wind may be slightly in the face of stock investors over the next 3 months.
* * *
More from Dana Lyons, JLFMI and My401kPro.

![]()
Запись Stocks Entering Weakest Quarter Of The Presidential Cycle впервые появилась crude-oil.top.