General overview for 12/01/2017:
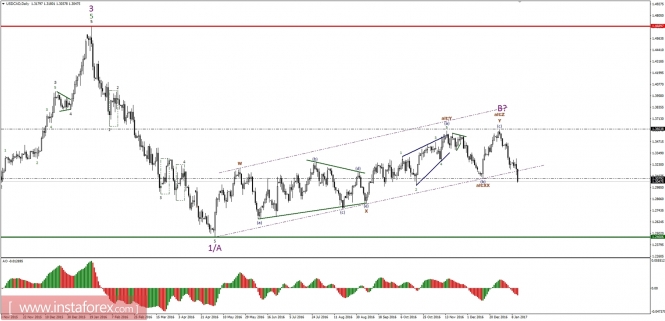
The blue impulsive count of 1/(a) had been invalidated when the level of 1.3080 was violated. Currently, the next best fit of the Elliott wave progression would indicate, that the top for the wave C (blue) of the wave Y (brown) would have terminated at the level of 1.3600. This level would be the top for the larger time frame wave B (purple), as per daily time frame chart. All of this suggest more decline towards the lows of the wave A (purple) around the level of 1.2460 and an eventual breakout lower. Nevertheless, please notice, this recent leg down might be still just a part of some larger corrective cycle.
Support/Resistance:
1.3600 – Wave B Top
1.3230 – Dashed Purple Channel Support
1.3080 – Technical Support
Trading recommendations:
Day traders and swing traders should refrain from trading as the market is evolving into more complex corrective cycle, which is full of whipsaws and false breakouts. Please wait for the next trading setup to occur shortly.
The material has been provided by InstaForex Company – www.instaforex.com
The post Technical analysis of USD/CAD for January 12, 2017 appeared first on forex-analytics.press.