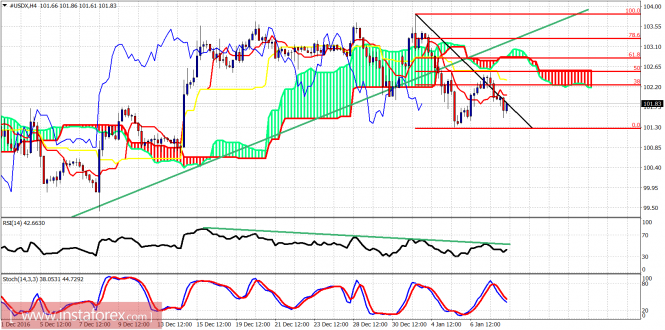
As expected, the dollar index got rejected at resistance and is back near its lows made on January 4th. The reversal in the index is of a bigger degree than normal and I expect further decline in the next few days. However the 102.50 mark is a key level now.

Green line – support (broken)
The dollar index broke below the green trend line which was an important short-term support. Price bounced to back test the breakout area and got rejected by the Ichimoku cloud and the 50% Fibonacci retracement. Short-term resistance is now at 102.50 and bulls need to break it in order to see new highs near 104.50-105.

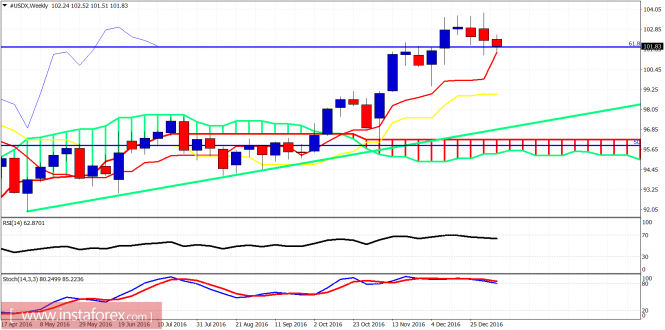
Green line – long-term support
The weekly candle is weakening and has broken the first important support of 102.16 which I mentioned yesterday. Next important support is at 101.28. If we break below it, we should expect a sharp move lower towards 99. Oscillators were warning for a pullback over the past few weeks and I believe the uptrend is unfolding and an important correction has started.
The material has been provided by InstaForex Company – www.instaforex.com
The post Technical analysis of USDX for January 10, 2017 appeared first on forex-analytics.press.