Most Americans will gather around their televisions on Sunday night to watch the Super Bowl 53 matchup between the New England Patriots and the Los Angeles Rams. Whether you love or hate Touchdown Tom, there is no denying his dominance at the ripe old age of 41 is impressive. Appearing in his ninth Super Bowl, roughly 17% of all the Super Bowls, we now have sufficient data to analyze the market trends on how the stock market performs with a Terrific Tom win or an NFC upset.
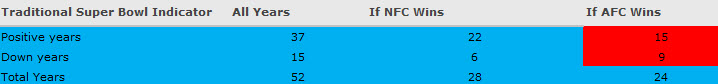
Traditional Super Bowl Indicator
Over the past couple of decades, we have seen Wall Street point out that stock market typically performs better when an NFC team has won the big game. But recent data, has shown the traditional Super Bowl indicator may be losing its effectiveness. The average full year returns with an NFC team winning have declined, but it still may take several years for the AFC to close the gap between the difference between up and down years.
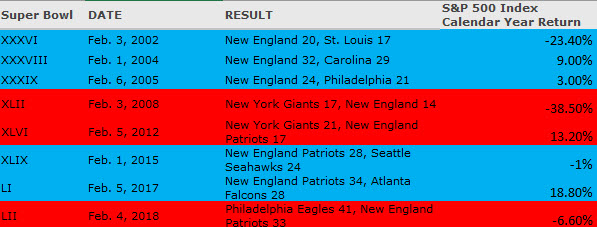
Tom Brady Indicator
Tom Brady’s Super Bowl record currently stands at five wins and 3 losses and stock market bulls may want to cheer for TB12 this weekend. The Brady Indicator shows that S&P 500 index has delivered far better returns when he wins the championship. The 3 Super Bowl defeats for Tom have yielded two declines and one 13% rally.
Stocks are already off to a good start in 2019, so that could be a good sign for Patriot fans. Some may argue that the big city effect could be a better barometer and Ram fans may like the argument. They did lose to Tom Brady in his first Super Bowl appearance in 2002, back when they played for a much smaller market in St Louis. The Rams organization has moved around quite a bit in their history and have now returned to Los Angeles, the second most populous cities in the United States.
US stocks trade mix after a very busy week with corporate earnings and key employment data that showed the US job market remains strong.