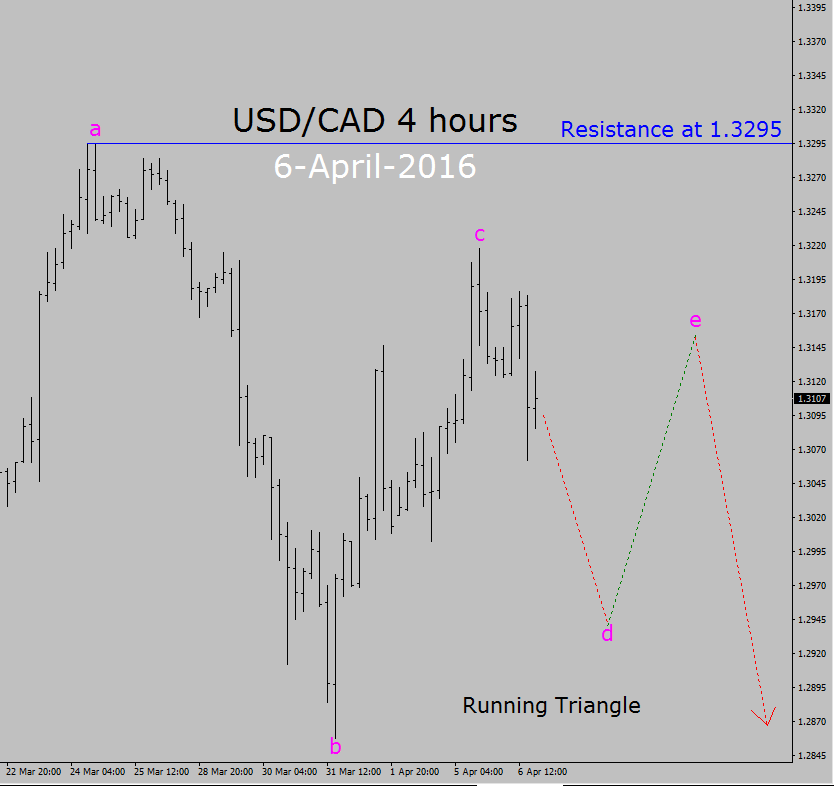
So, as long as price stays below 1.3295 resistance level, the trend is going to remain down and we could look for a sell trade. However; if price breaks above 1.3295 key resistance level then bearish trend is going to fail. In such case I will stay out of the market and re-analyze the price action in USD/CAD four hours chart.