The dollar has spent 2016 in a downtrend against the yen but has taken a bullish turn over the last few trading sessions, breaking through the ichimoku cloud on the daily chart and above the 55 and 89-day simple moving averages.
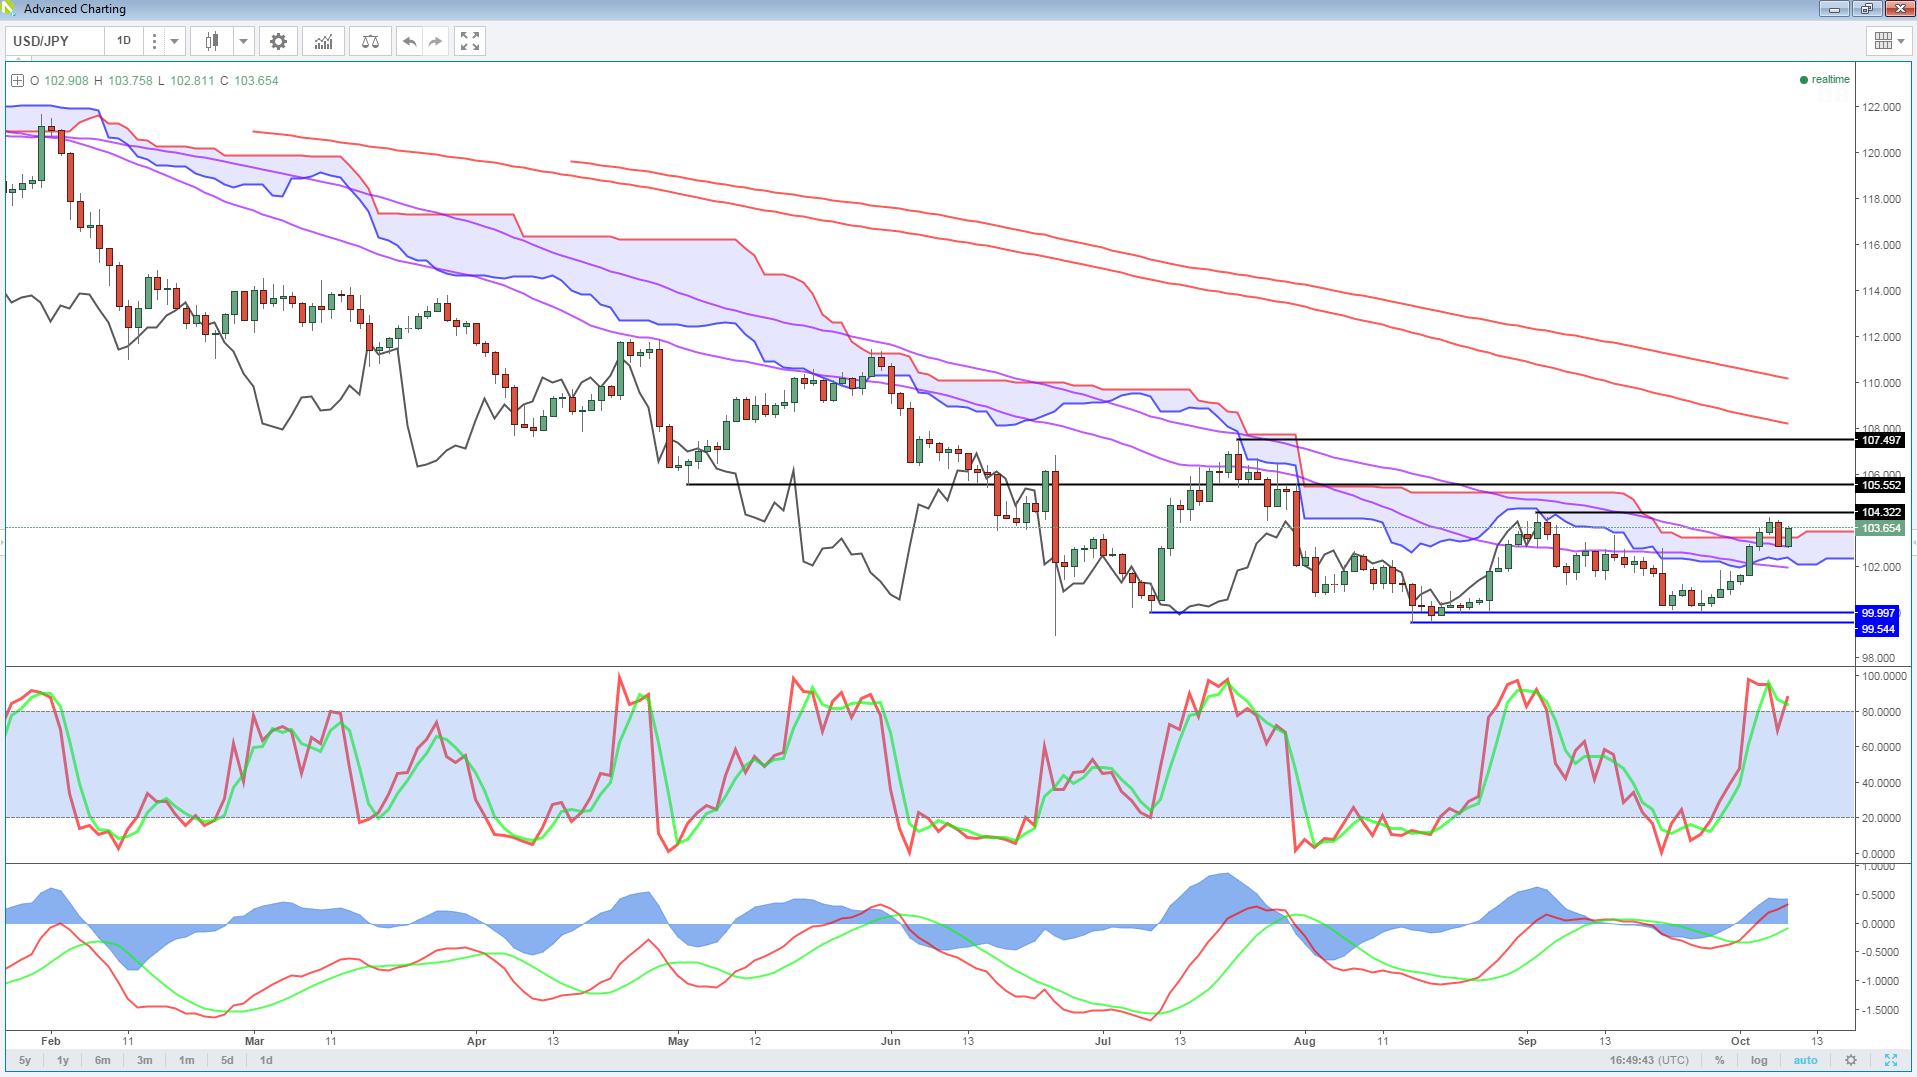
This in itself is a very bullish move but it will become increasingly so if confirmation of it follows. Initial confirmation appears to have happened already, with the 89-day SMA providing support on the retest following some early dollar weakness and profit taking. Should the move hold up, it will also ensure that while the cloud was also tested, price failed to break back below.
OANDA MP – Oil Surges on Putin Comments (Video)
The next confirmation of the bullish break could come from a move through 104.32, breaking above the 2 September resistance as well as last week’s in the process. This series of higher lows and higher highs is another sign that the pair has entered into a bullish trend, although it doesn’t obviously tell us how long for.
The final confirmation would come from the lagging line (black line 26 candles behind) breaking through the top of the cloud, which would require price to break above 105.25 over the next couple of weeks. After that, the top of the cloud drops making the task that little bit simpler (in theory).
WTI/USD – US Crude Jumps as Russia Says Will Join OPEC Deal
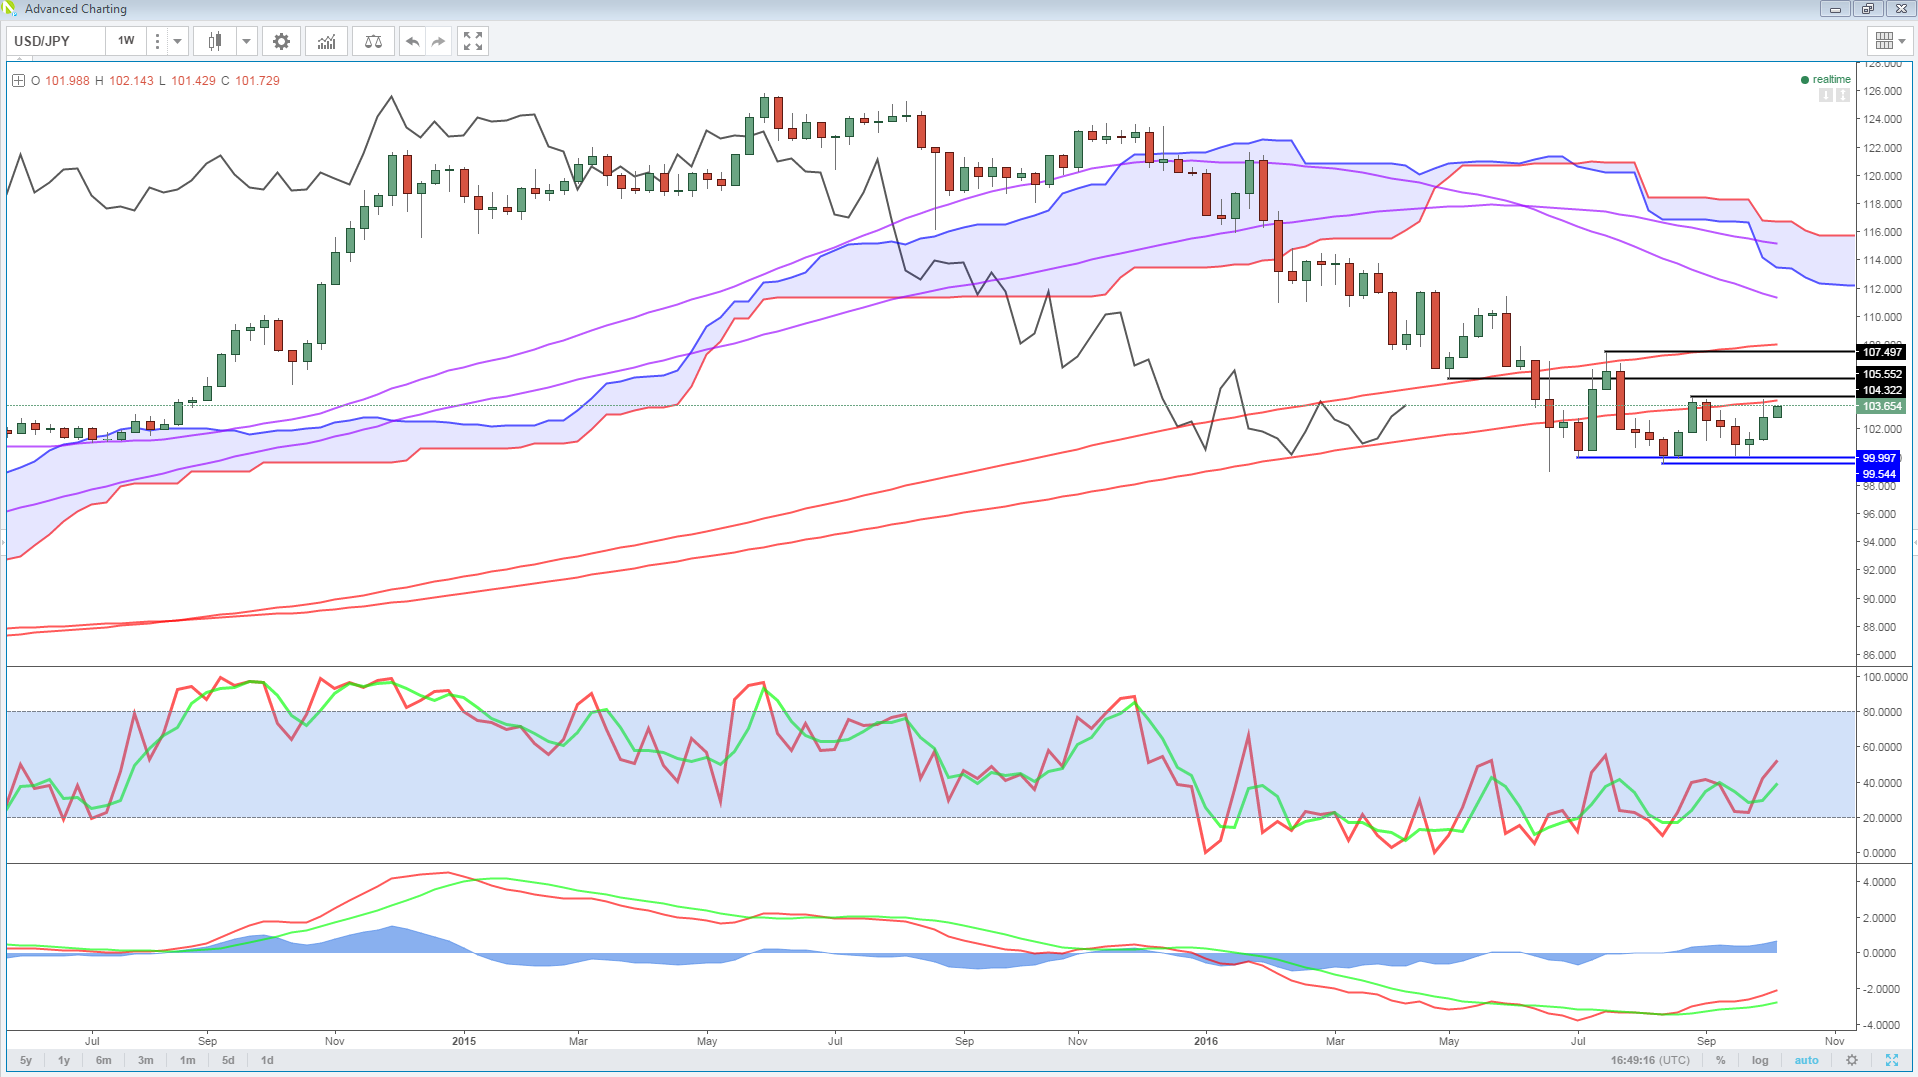
Above here, the pair could run into some resistance around 105.50, but the next real test should come around 107.50, 21 July high. The 200-day SMA could also provide resistance around this levle. As could the 200-week SMA. Ultimately though, as per the weekly chart, the pair remains in a longer term downtrend and could do for some time.