Daily Markets Broadcast

2018-10-29
Wall Street slides despite better GDP
Despite a stronger-than-expected US GDP print for the third quarter, the US30 index fell to the lowest in nearly four months on Friday. Europe put back the clocks by one hour at the weekend while UK’s autumn budget is presented today.
US30USD Daily Chart
-
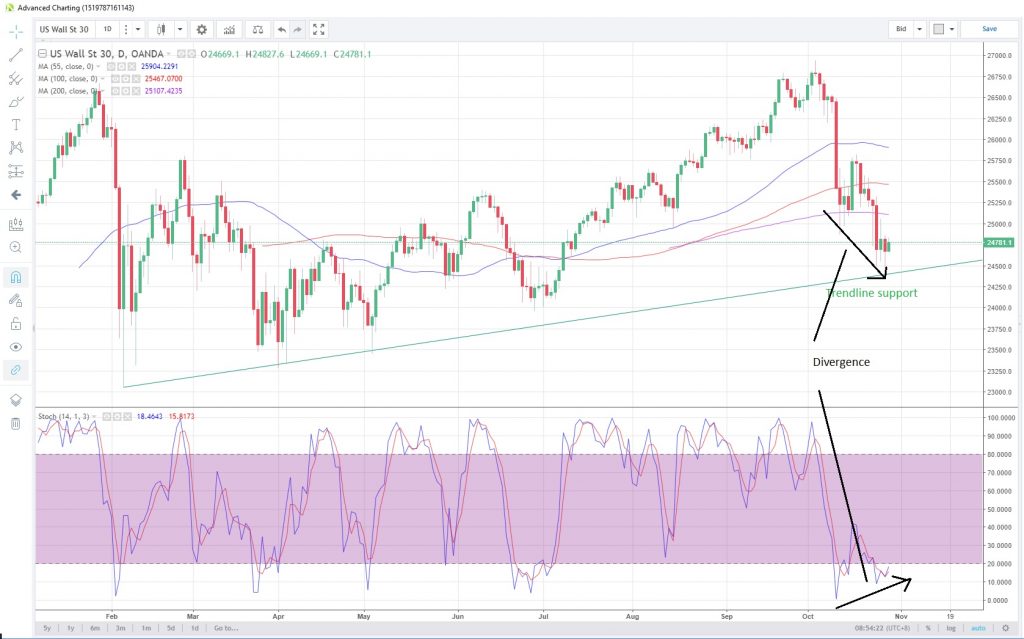
The US30 index touched its lowest since July 6 on Friday, despite US Q3 GDP coming in better than expected. Uninspiring results from tech bellwethers Amazon and Alphabet added pressure
-
The index rebounded off trendline support on the daily chart from the February low around the 24,388 level on Friday. Possible bullish divergence unfolding on daily stochastics chart
-
The personal consumption expenditure prices index, the Fed’s favored monitor of inflation, for September is due today. August’s index rose 0.1% m/m and any acceleration in prices would be detrimental to the index.
DE30EUR Monthly Chart
-
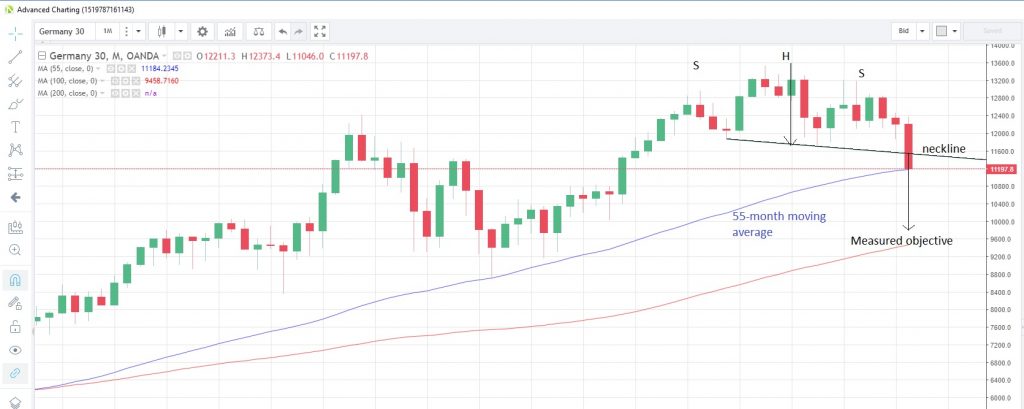
The Germany30 index fell on Friday, driven by the declines on Wall Street, though held above the 22-month low struck the previous day
-
The index is testing support at the 55-month moving average at 11,184, which has supported prices on a closing basis since December 2011. Head and shoulders reversal pattern on monthly chart is still unfolding
-
Reminder: Europe put back the clocks by one hour last weekend.
UK100GBP Monthly Chart
-
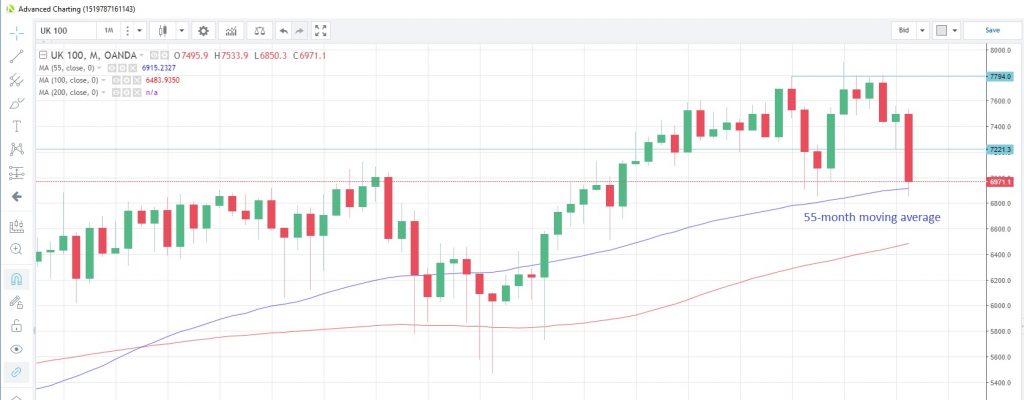
The UK100 index slumped to its lowest level since December 2016 as protracted Brexit issues continue to weigh
-
The UK100 index traded below the 55-month moving average for the first time since June 2016 (Brexit referendum) on Friday
-
UK Chancellor of the Exchequer presents his autumn budget to parliament today


